气力输送根据工作原理可以分为正压输送与负压输送,正压输送是利用大于大气压力的空气进行输送,负压输送是将空气与物料一同吸入管道内进行输送。由于具备较高的安全性、 低运营成本、 低维护要求以及布局灵活等优点,因此气力输送已经广泛应用于各个行业,涉及固体颗粒处理的大部分分支[1-5]。例如,在采矿和能源领域,煤粉、 矿石粉等物料的运输与气力输送息息相关;在化学工业中,也会经常使用气力输送装置来运输纯碱、 聚乙烯等工业原料,但是在大量的气力输送过程中,雾化后的液体会附着在颗粒表面,与颗粒混合形成湿颗粒,造成颗粒粘结、 团聚等现象[6-7]。一般来说,增加颗粒的含水率会降低其流动性,当含水率大于限值时,整个输送系统无法正常运行,从而造成重大的经济损失,因此,探索湿颗粒在管道中的流动行为和水分对流动特性的影响显得尤为重要。
近年来,由于计算机的计算能力逐步提高,数值模拟已成为研究管道气力输送的有力工具,并且计算流体力学(computational fluid dynamics,CFD)与离散元方法(discrete element method,DEM)的基础理论也逐步扩展完善,因此越来越多的学者采用CFD-DEM方法对气力输送进行研究[8-11]。在过去的几年中,人们对湿颗粒和相应的液桥进行了各种研究。Rabinovich等[12]在球面与平面间毛细力计算公式的基础上,推导出了2个球面间毛细力的计算公式,并使用原子力显微镜的实验测量验证了所开发的公式;Sun等[13]提出了适用于非对称配置的球形粒子的液桥模型,适用于广泛的液体体积、 接触角和半径比,模型的相对误差在10%以下,具有较好的毛细力计算精度;Xiao等[14]通过实验研究了液桥轮廓由凸到凹的转变以及与之相关的毛细力,在相对较大的水体积和较小的分离距离下,毛细力保持近似恒定,表现为凸液桥;随着分离距离增加,毛细力先增大后减小,液桥由凸向凹拉伸;Kantak等[15]使用2种实验方法对粒子与干壁或湿壁的低速碰撞进行研究, 粒子与湿壁碰撞时, 对于更黏的润湿层,在低于临界冲击速度时,黏性耗散导致黏滞; Xiao等[16]使用其提出的液桥力模型对干湿颗粒输送中弯头的侵蚀进行了研究,在液桥力的作用下,湿颗粒倾向于黏附在弯头内壁,形成了覆盖冲击区域的颗粒层,降低了一定程度的弯头侵蚀深度和侵蚀比例;Wang等[17]使用2D几何模型比较了垂直管中干、 湿颗粒的流动特性,定量分析了湿颗粒的团聚特性;Olaleye等[18]使用JKR模型模拟湿颗粒以及相对应的液桥力,对弯管中黏性乳粉的气力输送进行了实验和模拟研究,结果表明,在低气力流速下,湿颗粒容易在弯管出口处团聚,然后沉积在管道底部。
综上所述,在以往的研究中,对于气力输送湿颗粒间的毛细力多使用不完善的液桥力模型,或使用JKR模型进行代替,而在实际的颗粒分离过程中,液桥存在由凸到凹的拉伸过程,所以模拟结果与实际结果会产生较大的误差[19-20]。本文中以管道输送基础理论为中心,结合不同工况下的真实情况,采用液桥轮廓由凸到凹的毛细力模型,通过物理表征、 数学计算等方法,以改变水平管中物料输送的流动特性为研究目标,分析不同含水率颗粒在输送过程中的动力学特性变化规律,对湿颗粒气力输送的内在机制进行研究。
1 相关理论
基于CFD-DEM耦合方法,对于连续相,采用RNG k-ε模型;对于离散相,颗粒的运动通过牛顿动力学方程求解[21-22]。
1.1 连续相控制方程
气相作为连续相满足连续方程和动量守恒方程。气相连续性方程为
(1)
动量守恒方程为
(2)
式中: t为时间; ρg为气体密度; αg为气体体积分数; Pg为气相压力;![]() 为重力矢量; Kgs为气固相之间动量交换系数;
为重力矢量; Kgs为气固相之间动量交换系数; ![]() 和
和![]() 分别为气体和颗粒速度。式(2)中黏性应力张量
分别为气体和颗粒速度。式(2)中黏性应力张量![]() 定义为
定义为
(3)
RNG k-ε模型中的湍动能k和湍动能耗散率ε,计算方程为
(4)
(5)
式中: Gk为平均速度梯度引起的湍动能; Gb为由浮力产生的湍流动能; Cε1和Cε2的默认值为1.42和1.68; ui为速度矢量; μe为气体有效黏度; xi、 xj为颗粒空间坐标; αk和αε分别为k和ε的有效普朗特数的倒数。
1.2 离散相控制方程
通过在拉格朗日坐标系下对粒子的运动方程进行积分,获得粒子的运动轨迹。基于牛顿第二定律建立的颗粒运动的控制方程为
(6)
(7)
式中: mp为颗粒质量; vp为平移速度; ωp为角速度; Ip为转动惯量; Fw-p为壁面与颗粒间作用力; Ff为流体与颗粒间作用力; Fp-p为颗粒间作用力; Wp为颗粒所受力矩。
1.3 连续相与离散相相互作用
根据式(2)和式(6),连续相与离散相之间通过动量交换实现耦合
(8)
式中Kgs为动量交换系数,本文中采用Gidaspow[23]等给出的公式

(9)
式中: ds为颗粒当量粒径; CD为与颗粒雷诺数Res相关的阻力系数。其中

(10)
颗粒雷诺数定义为
(11)
1.4 液桥力模型
颗粒之间或颗粒与壁面之间的少量液体形成液桥,产生液桥力fl,ij 。本文中使用的液桥力模型为Xiao等[14]通过计算建立的由凸到凹的液桥力模型,在含水率(质量分数,下同)、 粒径和分离距离方面, fl,ij为

(12)
式中: γ和θ 分别为水的表面张力和接触角; nij为粒子i到粒子(或壁面)j的单位向量;![]() 为粒子i和粒子(或壁面)j之间的距离;
为粒子i和粒子(或壁面)j之间的距离;![]() 为颗粒间的距离;
为颗粒间的距离;![]() 为颗粒到壁面之间的距离;
为颗粒到壁面之间的距离;![]() 为液桥从凸过渡到凹的临界距离;A、 B、 C为模型参数,与破坏距离
为液桥从凸过渡到凹的临界距离;A、 B、 C为模型参数,与破坏距离![]() 按照表1的相关系数计算。
按照表1的相关系数计算。
表1 液桥力模型的模型参数
Tab.1 Model parameters of liquid bridge force model

颗粒与颗粒之间颗粒与壁面之间A=-(0.51-0.073lnV∗)V∗-0.569A=-1.43V∗-0.556B=(1.05lnV∗+1.64)(θ+3.2V∗+17.7)2+0.48B=(1.23lnV∗+0.51)(θ+3.6V∗+19)2+1.2+0.1V∗-0.32C=0.004 2lnV∗+0.007 8C=0.013lnV∗+0.18D^r=(0.62θ+0.99)V∗0.33D^r=(0.22θ+0.762)V∗0.205 注: A、 B、 C为模型参数, D^r为破裂距离, V∗为液桥的体积。
2 数值模拟设置
2.1 计算模型及网格划分
选取长度为0.5 m,管道直径为20 mm的水平管道进行计算。管道的几何模型通过Soildworks软件建模,网格划分使用ICEM软件,采用六面体结构化网格,节省计算时间,使计算结果更加精确。管道几何模型和网格划分见图1、 2。
图1 水平管道示意图
Fig.1 Diagram of horizontal pipe

图2 网格划分
Fig.2 Grid division
2.2 物性参数与边界条件
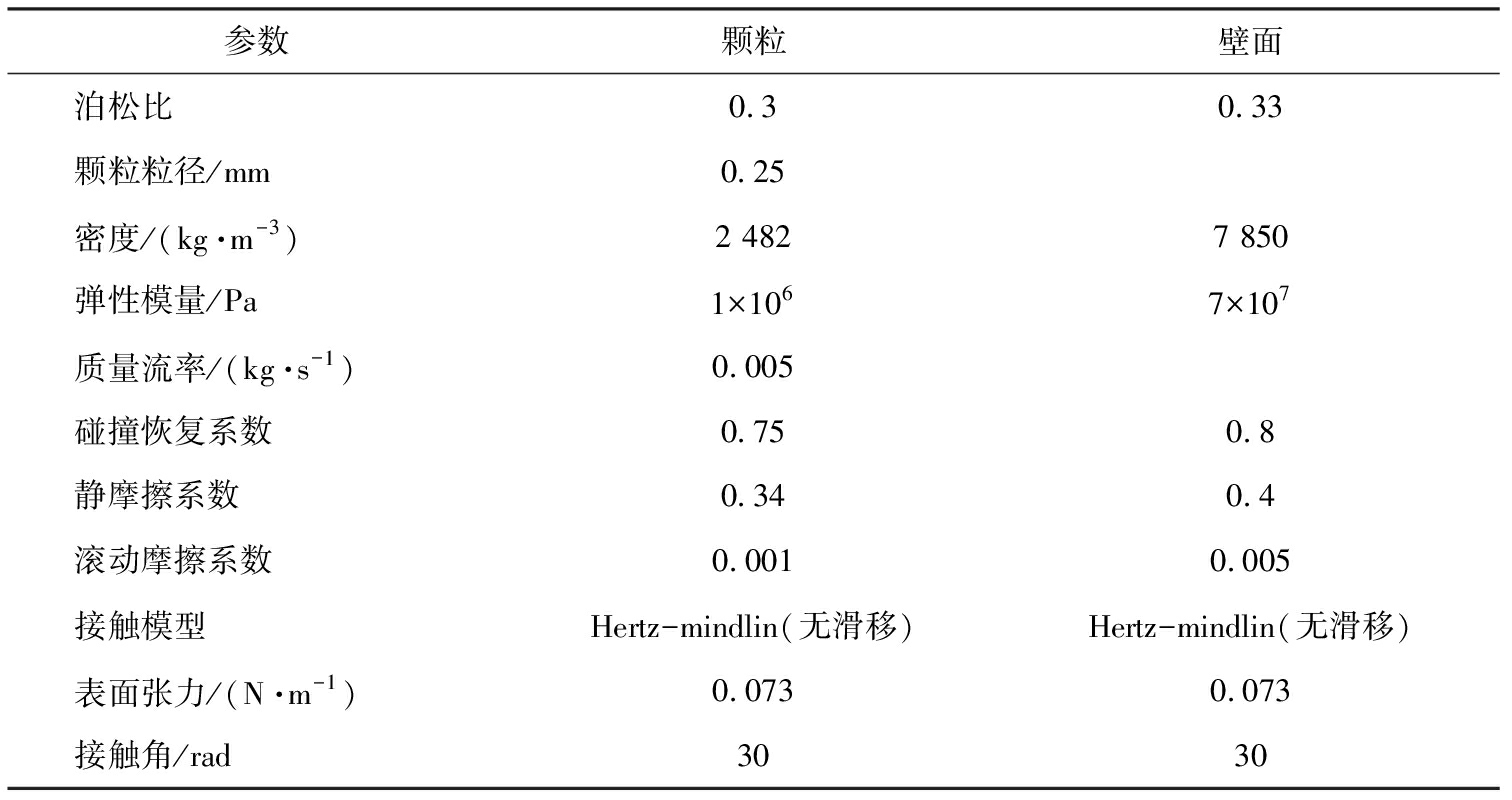
表2、 3列出了模拟条件,其中颗粒与壁面所使用的材料分别是沙子与碳钢。颗粒以恒定的固体流速和较小的初始速度注入到管道中。对于气体流动模型,在入口处采用固定的均匀速度剖面,在壁面处采用无滑移条件。在DEM模拟中,管壁被视为直径无穷大的刚性球体,没有粒子与管壁相互作用引起的位移或运动。考虑到计算资源以及计算速度,对流体和颗粒进行周期性设置,使用周期性边界条件来考虑一个短管道。
表2 固相物性参数
Tab.2 Solid phase physical parameters
参数颗粒壁面泊松比0.30.33颗粒粒径/mm0.25密度/(kg·m-3)2 4827 850弹性模量/Pa1×1067×107质量流率/(kg·s-1)0.005碰撞恢复系数0.750.8静摩擦系数0.340.4滚动摩擦系数0.0010.005接触模型Hertz-mindlin(无滑移)Hertz-mindlin(无滑移)表面张力/(N·m-1)0.0730.073接触角/rad3030
表3 液相性质
Tab.3 Liquid phase properties

参数数值密度/(kg·m-3)1.183黏度/(Pa·s)1.843×10-5参数数值入口速度/(m·s-1)5时间步长10-5
3 结果与讨论
3.1 模型验证与网格无关性验证
由于在现有的气力输送湿颗粒相关文献中未找到合适的相关实验数据,因此本文中采用Xiao等[16]的数值模拟数据来验证模型正确性。使用双向耦合的方法进行模型验证,模拟的参数条件与Xiao等[16]的参数条件完全相同,计算达到稳态后提取弯头外拱处中心线的颗粒速度数据,结果对比如图3、 4所示(图中w代表颗粒含水率)。从图中可以看出,干颗粒与湿颗粒在弯头处存在明显差异,在曲率角为40°~50°时,干粒子速度减小至约2 m/s,而湿粒子速度变化较大,减小至约0.5 m/s。模拟结果对比最大误差不超过10%,初步验证了本次研究所采用的计算模型的正确性。
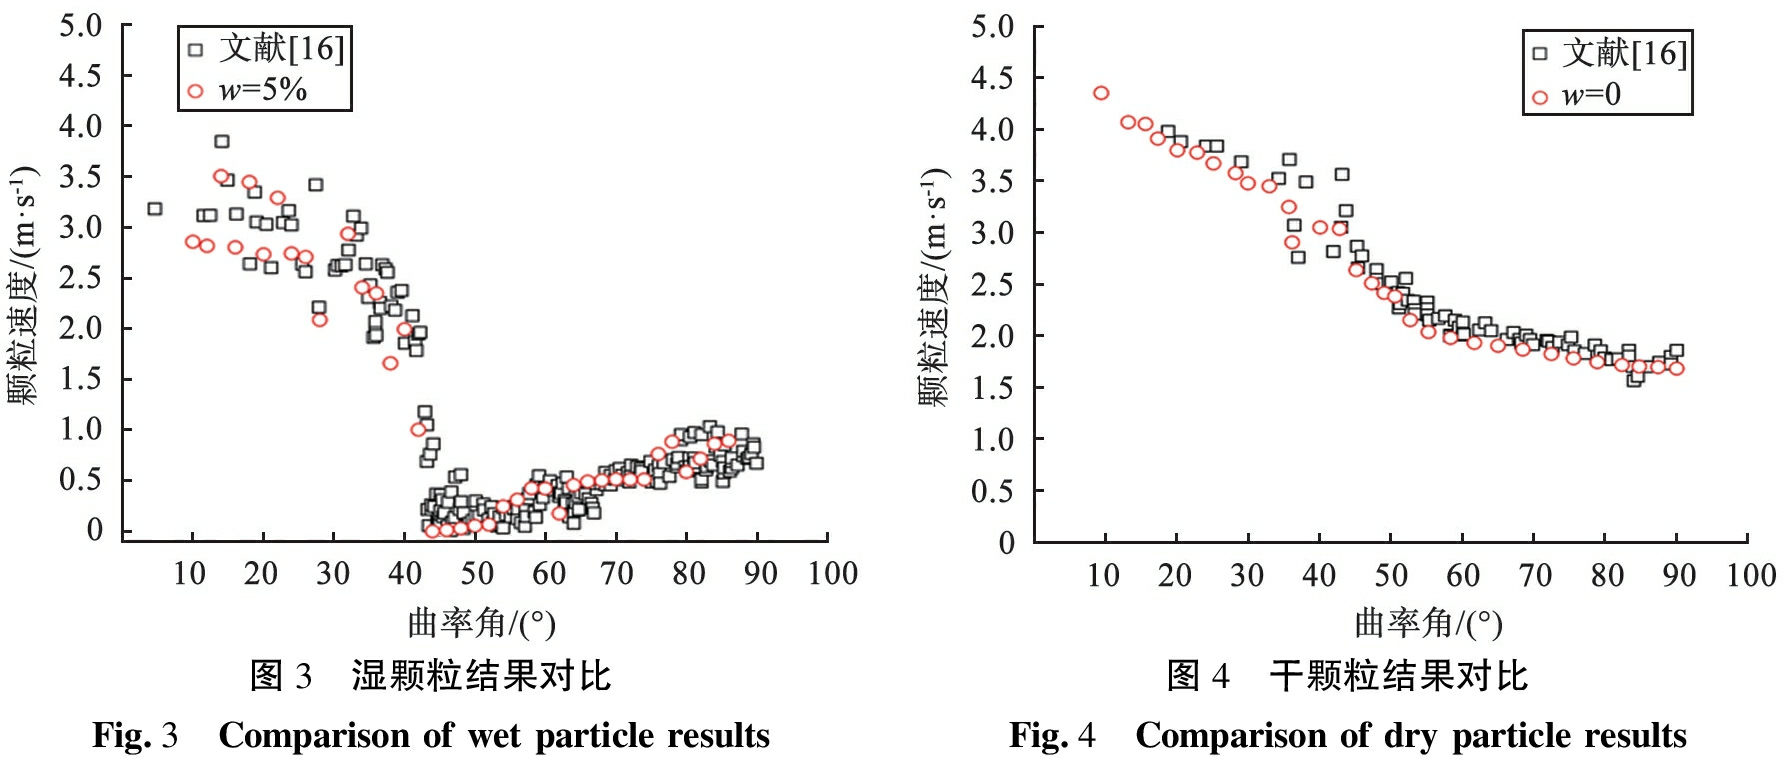
图3 湿颗粒结果对比Fig.3 Comparison of wet particle results图4 干颗粒结果对比Fig.4 Comparison of dry particle results
网格分辨率是影响计算结果准确性的重要因素。 为了确保数值模拟结果的可靠性和准确性, 需要进行网格无关性验证。 一般而言, 采用更小的网格可以得到更为准确的结果, 但是, 随着网格尺寸的减小, 所需的网格数量会增加, 导致计算时间的增加, 所以需要在精度和计算时间之间进行权衡和选择。 为了能够得到准确的模拟结果, 使用较为精细的网格至关重要, 本研究选取了3种尺寸的网格进行比较, 最大边长分别为0.7、 1、 1.5 mm, 对应的网格数量分别为1.3万、 0.9万、 0.6万。 图5所示为3种网格模拟结果对比。 由图可知, 网格整体趋势无明显差异, 边长为0.7、 1 mm的网格可以更准确模拟颗粒的速度大小, 而边长为1.5 mm的网格存在一定误差。 综合考虑计算资源与计算时间, 采用边长为1 mm的网格进行计算。
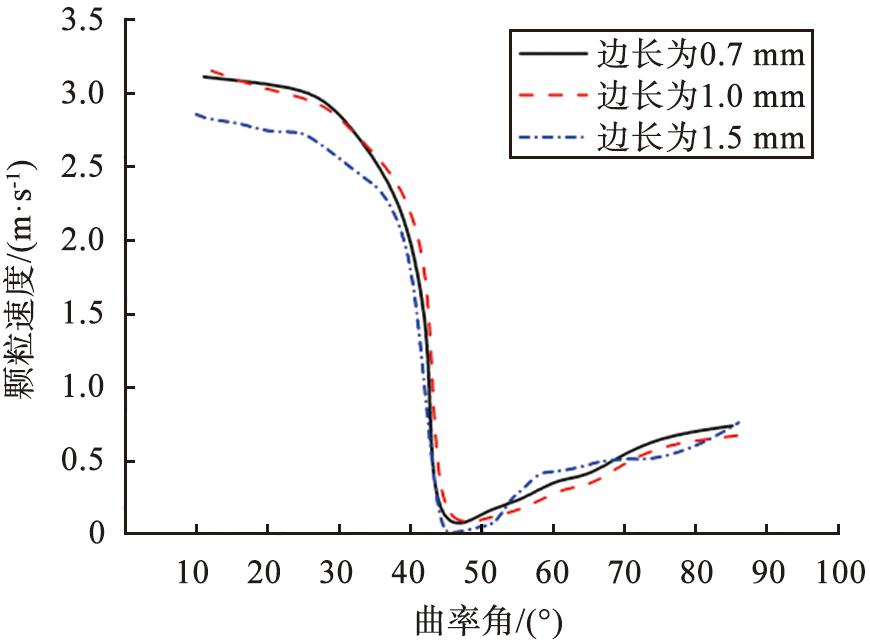
图5 3种网格模拟结果对比
Fig.5 Comparison of three grid simulation results
3.2 输送流态对比
图6所示为水平管中干颗粒与不同含水率的湿颗粒在稳定状态下的流动行为。由图可以看出,干湿颗粒在管道中的整体分布都具有显著的非均质性,但干颗粒与湿颗粒呈现出完全不同的流动特性。由于颗粒与颗粒间(或颗粒与壁面间)的摩擦、 碰撞,颗粒自身重力,气速的降低以及气流分布不均匀等因素的影响,干颗粒沉降在管道底部,越接近管底处颗粒分布越密集,因此表现为管底流的运动状态。湿颗粒以单粒子和颗粒团2种形式运动。原因是粒子之间的脉动,使得部分粒子相互靠近,当颗粒间的最小间距小于临界破裂距离时,颗粒在液桥力的作用下聚集在一起,逐渐形成较大的颗粒团。当颗粒含水率为1%时,单颗粒和颗粒团数量较多,随着颗粒含水率的增加,单颗粒和颗粒团的数量减少,当颗粒含水率为5%时,只有少数单粒子和颗粒团存在。这是由于颗粒含水率越大,颗粒间的临界破裂距离和液桥力越大,颗粒更容易黏结在一起,液桥力随颗粒间分离距离的变化如图7所示。
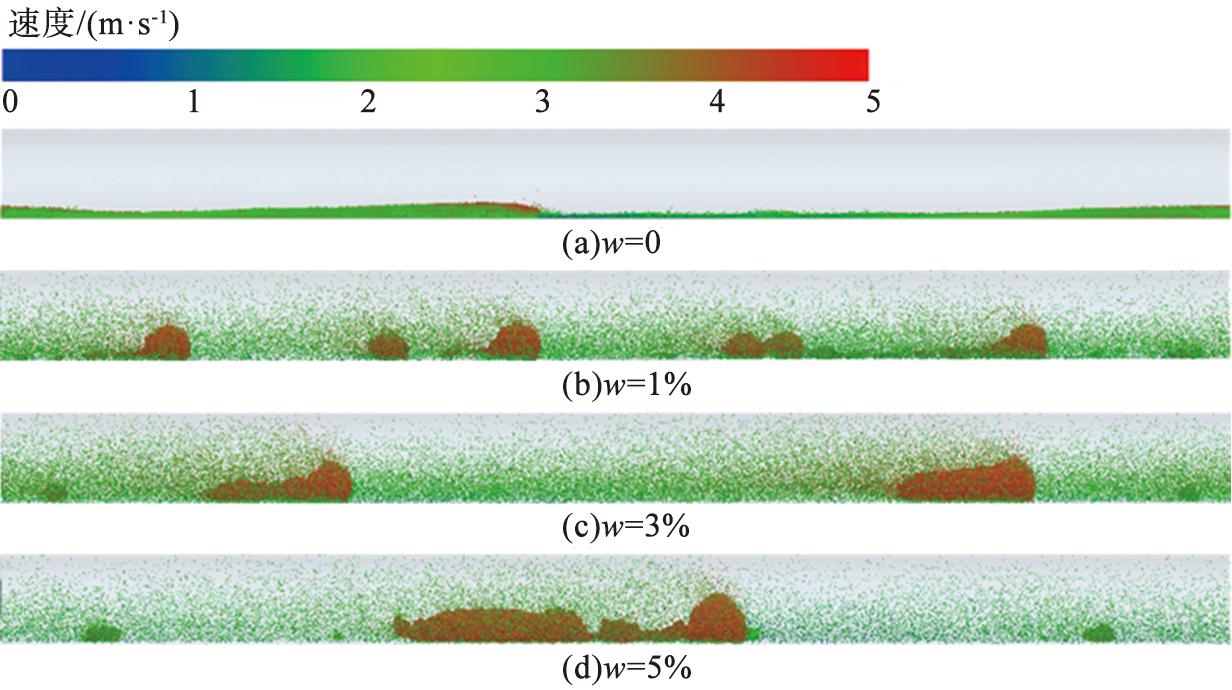
图6 水平管中干颗粒与湿颗粒稳定运动状态
Fig.6 Stable motion state of dry and wet particles in horizontal tube
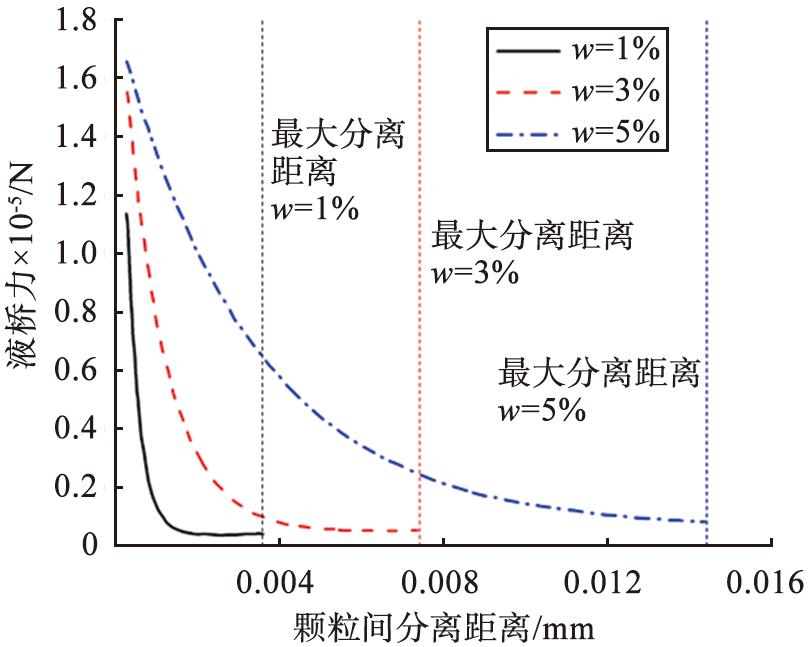
图7 液桥力随颗粒间分离距离的变化
Fig.7 Variation of liquid bridge force with separation distance between particles
3.3 颗粒浓度对比
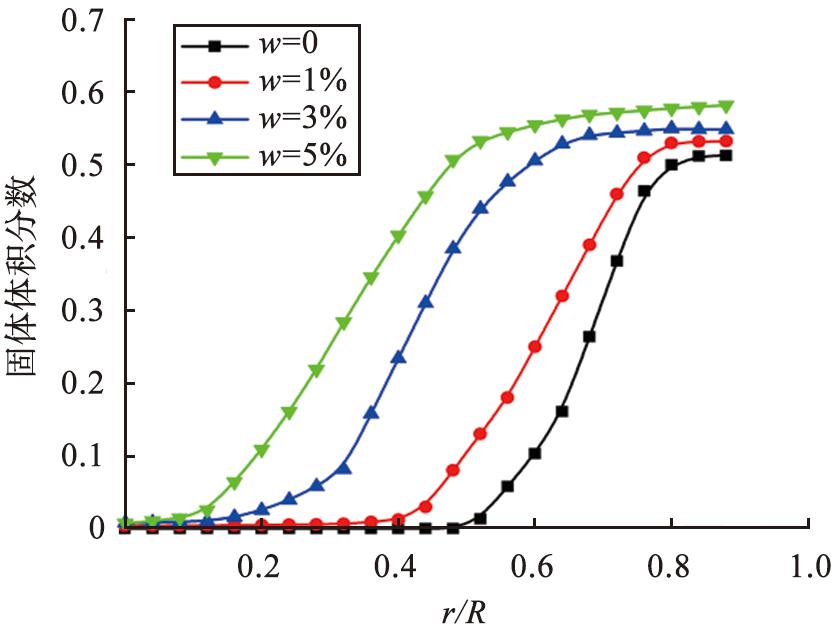
干湿颗粒输送在5 s时的固体体积分数分布见图8。相较于干颗粒,湿颗粒固体体积分数分布不均匀,当颗粒含水率为3%时,管道高度为0.1~0.15 m处的固体体积分数明显比管道轴向中心处的大,表明颗粒聚集在一起,存在团聚现象,且颗粒含水率越大,团聚现象越严重。这是由于当颗粒含水率增加时,颗粒间的液桥力和临界破裂距离增大。在气流的作用下,颗粒不断地碰撞黏附,从而形成越来越大的颗粒团,导致固体体积分数分布不均匀。 此外, 当颗粒团在管道内沉积时, 受重力的影响, 管道壁面会成为颗粒沉积的主要区域, 也就是沉积带, 在这个区域内, 固体体积分数会更大。 图9所示为不同含水率颗粒团浓度的径向分布。 由图可知, 壁面的固体体积分数大于中心的, 中心的变化大于壁面附近的, 且随着颗粒含水率的增加,中心颗粒体积分数增大, 说明颗粒团变大, 管道内非均质性增强。
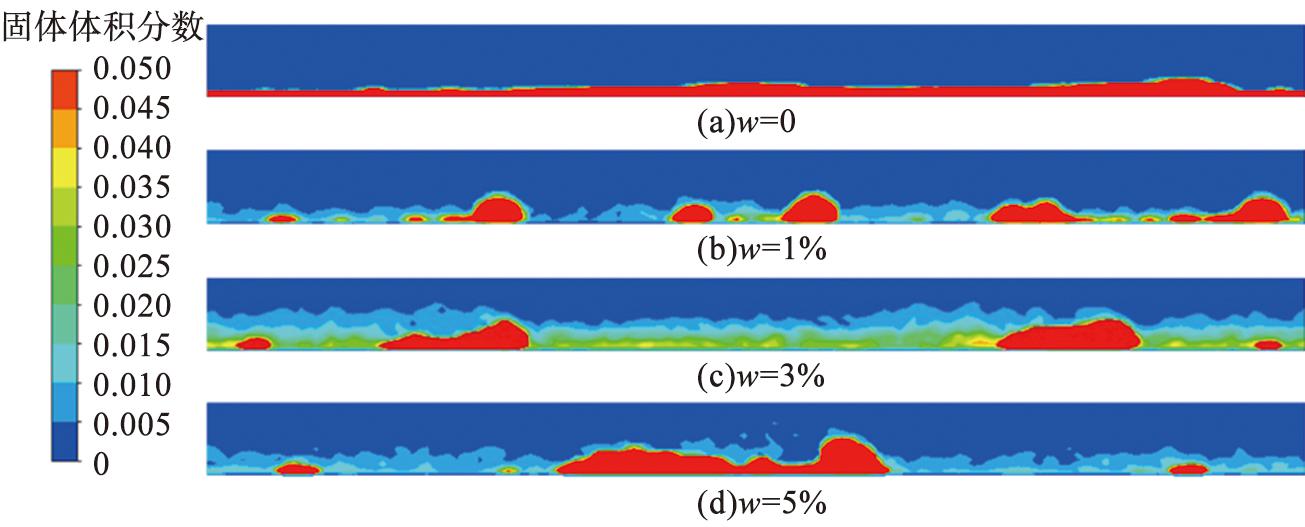
图8 不同含水率颗粒输送5 s时固体体积分数分布
Fig.8 Distribution of solid volume fraction when particles with different moisture content are transported for 5 s
注: r/R为管道壁面至管道中心的距离比管道半径。
图9 不同含水率颗粒团浓度的径向分布
Fig.9 Radial distribution of particle concentration with different moisture content
3.4 颗粒速度分析
图10、 11所示为在管道高度为0.3 m处干颗粒和含水率为5%湿颗粒的平均颗粒速度随时间的变化情况。最初,颗粒的速度比较低,随着时间的推移,粒子速度出现波动变化,达到稳态后,呈周期性波动。其中干颗粒的速度平均值为3.41 m/s,而含水率5%的湿颗粒速度平均值为2.83 m/s,表明当颗粒表面含有水分时,管道内物料的输送效率会降低。湿颗粒在输送过程中颗粒间(或颗粒与壁面间)产生的液桥力,导致物料在输送过程中受到阻拦,从而降低了整体的输送速度。图12进一步反映了该现象,从图中可以看出,随着颗粒含水率的增加,颗粒的平均速度呈下降趋势,即颗粒的整体输送速度减小。
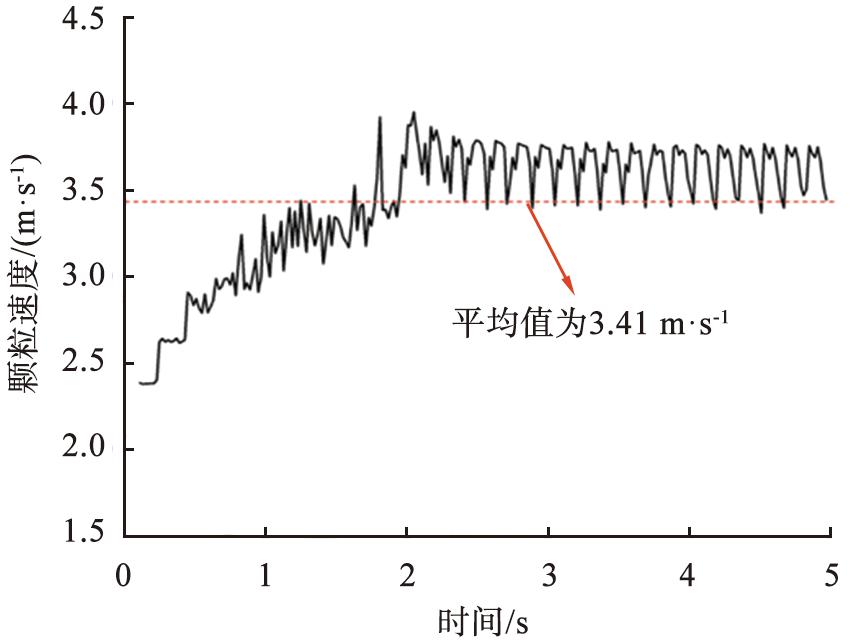
图10 管道高度为0.3 m处干颗粒平均速度随时间变化
Fig.10 Average velocity of dry particles changes with time when height of conduit is 0.3 m
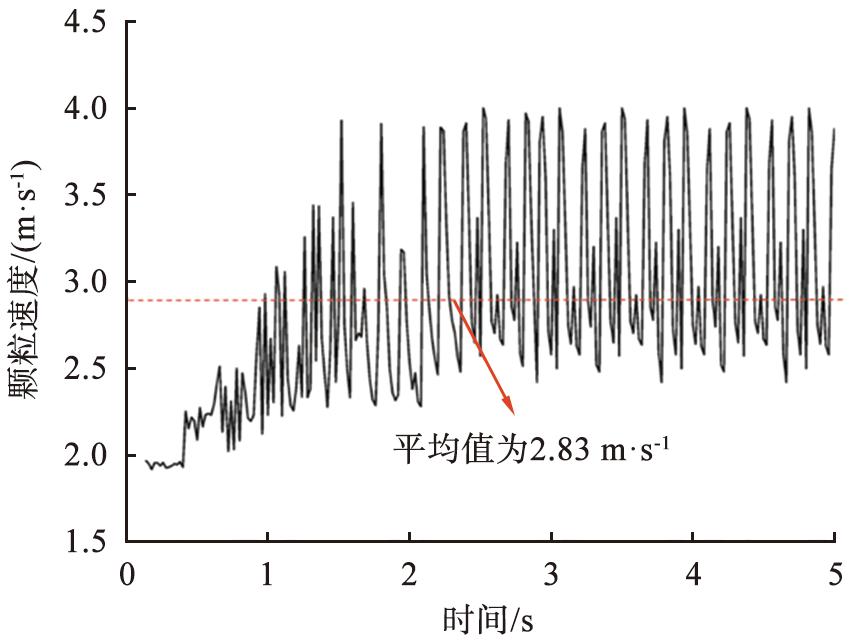
图11 管道高度为0.3 m处含水率为5%的湿颗粒平均速度随时间变化
Fig.11 Average velocity of wet particles with a moisture content of 5% changes with time when height of conduit is 0.3 m
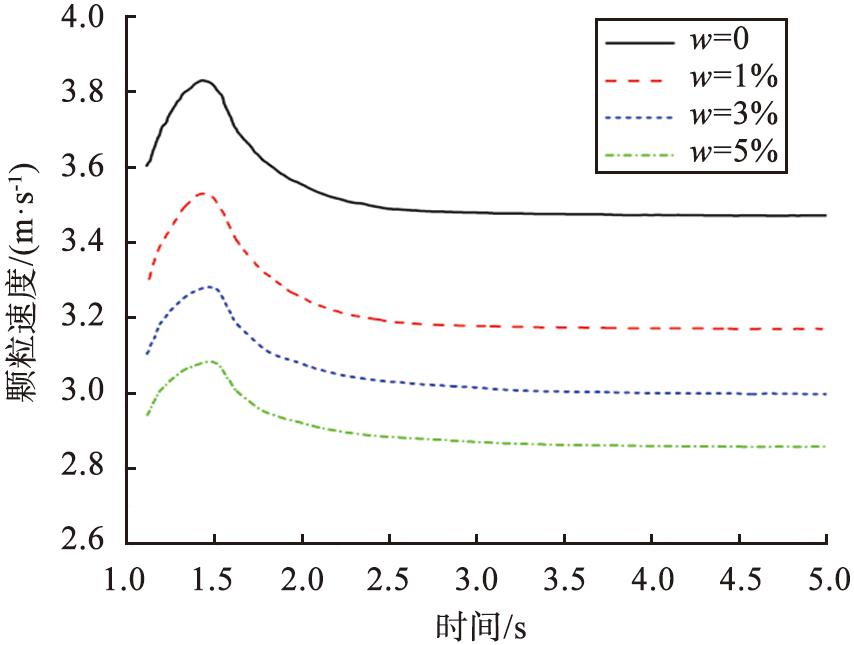
图12 不同含水率下管道整体颗粒平均速度随时间变化
Fig.12 Average particle velocity of whole pipeline changes with time under different water content
3.5 压缩力分析
图13所示为不同含水率下颗粒与壁面间平均压缩力随轴向位置的变化,其中干颗粒的颗粒-壁面间作用力较小,并且波动不大,湿颗粒的颗粒-壁面间作用力波动较大,其最大峰值随着颗粒含水率的增加而增大。这是由于干颗粒的运动状态为管底流,而湿颗粒以单粒子与颗粒团进行输送,导致颗粒与壁面间的作用力主要集中在颗粒团处,并且颗粒含水率越大颗粒越容易聚集,即颗粒团越大,使得颗粒-壁面间作用力增大。颗粒-壁面之间相互作用代表壁面磨损的宏观现象,说明湿颗粒对于壁面的磨损较干颗粒更大,且随着颗粒含水率的增加,壁面磨损更严重。
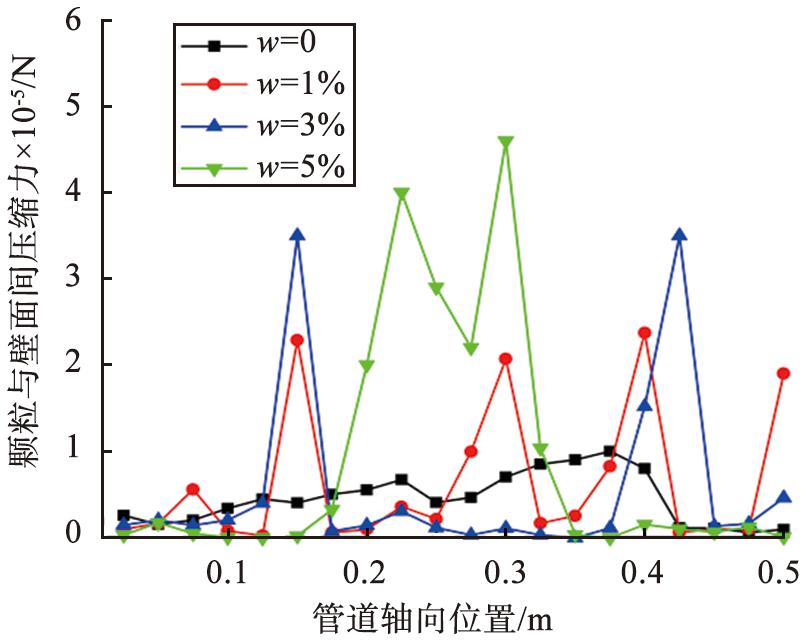
图13 不同含水率下颗粒与壁面间的平均压缩力随轴向位置变化
Fig.13 Average compressive force between particles and wall varies with axial position under different water content
3.6 湿颗粒的凝聚特性
粒子间的碰撞是颗粒团形成的主要原因之一。 在湿颗粒的输送过程中, 由于颗粒表面存在水分, 因此使颗粒间的吸附力增强, 导致颗粒之间更容易发生碰撞, 加剧了颗粒团的形成。 图14所示为颗粒含水率为1%时的碰撞粒子分数随时间的变化, 开始时, 由于初始状态下颗粒之间的间距比较大, 碰撞粒子分数为0, 随着时间推进, 在流体的作用下, 碰撞粒子分数迅速增加。 其中粒子-粒子碰撞分数(粒子间碰撞占粒子总数的百分比)的平均值为46%, 粒子-壁面碰撞分数(粒子与壁面碰撞占粒子总数的百分比)的平均值为9%。 图15给出了不同颗粒含水率下粒子碰撞分数平均值, 其中干颗粒的碰撞分数最低, 且碰撞分数随着颗粒含水率的增加而增大, 表明颗粒凝聚成了颗粒团, 与图6中的图像一致。
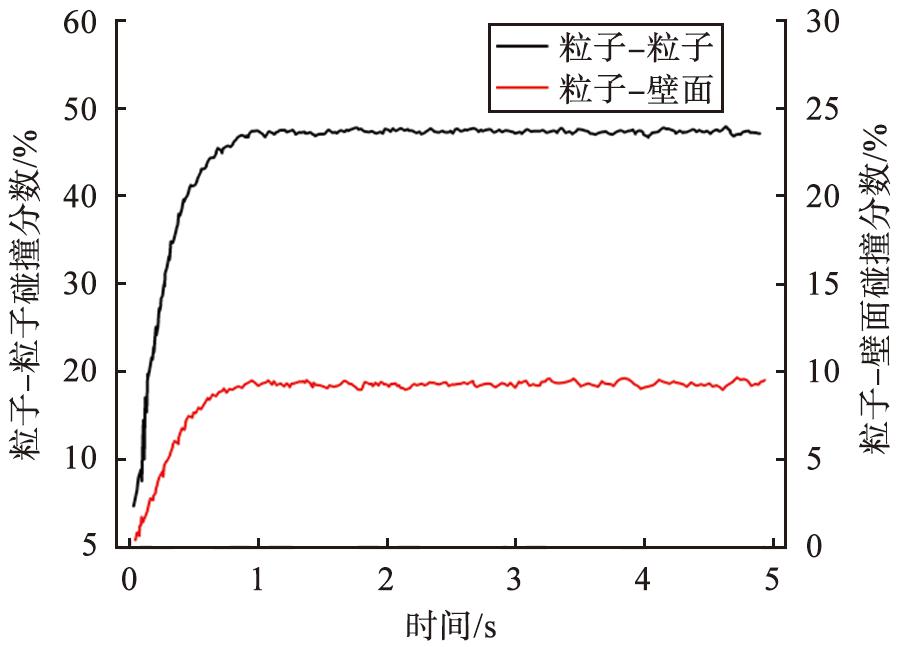
图14 含水率为1%时碰撞粒子分数随时间的变化
Fig.14 Change of percentage of colliding particles with time when moisture content is 1%
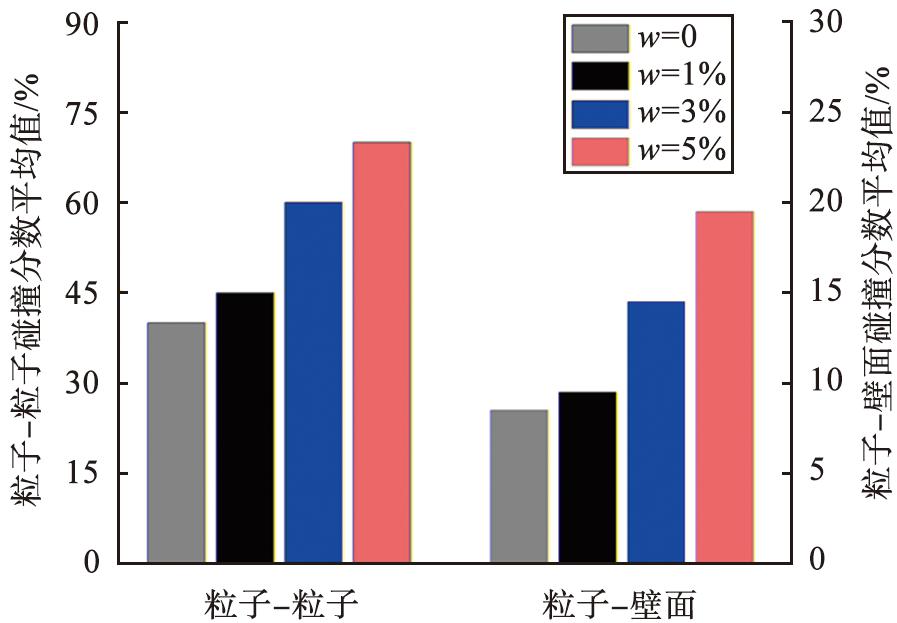
图15 不同含水率碰撞粒子分数的平均值
Fig.15 Average percentage of colliding particles with different moisture content
4 结论
1)干颗粒和湿颗粒在管道中的整体分布都具有显著的非均质性,但干颗粒沉降在管道底部,表现为管底流的运动状态,而湿颗粒因液桥力的作用而形成紧密的颗粒团块,以单粒子和颗粒团2种形式进行运动,并且颗粒含水率越大,颗粒团聚现象越严重。
2)湿颗粒的输送速度明显比干颗粒低,且随着颗粒含水率的增加,颗粒的平均输送速度呈下降趋势,表明颗粒的输送效率随着含水率的增加而降低。
3)相较于干颗粒,湿颗粒的颗粒-壁面间作用力更大,且随着颗粒含水率的增加而增大,表明颗粒对壁面的碰撞更剧烈,反映了湿颗粒对于壁面的磨损更加严重。
利益冲突声明(Conflict of Interests)
所有作者声明不存在利益冲突。
All authors disclose no relevant conflict of interests.
作者贡献(Author’s Contributions)
李政权进行了方案设计,徐止恒进行了模型开发和验证,数据分析以及论文的写作和修改,王贻得和武煜坤进行了文献调研,参与了论文的写作,李凯旋和石昊宇参与了模型开发和数据分析。所有作者均阅读并同意了最终稿件的提交。
LI Zhengquan carried out the scheme design, XU Zhiheng carried out the model development and verification, data analysis and the writing and modification of the paper, WANG Yide and WU Yukun carried out the literature research and participated in the writing of the paper, LI Kaixuan and SHI Haoyu participated in the model development and data analysis. All authors have read the last version of paper and consented for submission.
[1]KLINZING G E. A review of pneumatic conveying status, advances and projections[J]. Powder Technology, 2018, 333: 78-90.
[2]MIAO Z, KUANG S B, ZUGHBI H. CFD simulation of dilute-phase pneumatic conveying of powders[J]. Powder Technology, 2019, 349: 70-83.
[3]崔益华.水平管道负压气力输送CFD-DEM数值模拟[J]. 港口装卸, 2021(1): 63-67.
CUI Y H. CFD-DEM numerical simulation of negative pressure pneumatic conveying in horizontal pipeline[J]. Port Handling, 2021(1): 63-67.
[4]关佳斌, 裴旭明, 张琳荔, 等. 粮食颗粒群密相变径气力输送的流动特性[J]. 中国粉体技术, 2018, 24(2): 38-43.
GUAN J B, PEI X M, ZHANG L L, et al. Flow characteristics of grain particle group in dense phase change diameter pneumatic transportation[J]. China Powder Science and Technology, 2018, 24(2): 38-43.
[5]蔡海峰, 熊海泉, 周海军, 等. 考虑气相压缩性的高压密相气力输送数值模拟[J]. 发电设备, 2019, 33(2): 80-85.
CAI H F, XIONG H Q, ZHOU H J, et al. Numerical simulation of high pressure dense phasepneumatic conveying considering compressibility of gas phase[J]. Power generation equipment, 2019, 33(2): 80-85.
[6]PAN X, CHEN X, LIANG C, et al. Effect of moisture content on dense-phase conveying of pulverized coal at high pressure[J]. Korean Journal of Chemical Engineering, 2011, 28(10): 2086-2093.
[7]ZHOU H, XIONG Y, PEI Y. Effect of moisture content on dense-phase pneumatic conveying of pulverized lignite under high pressure[J]. Powder Technology, 2016, 287: 355-363.
[8]陈伟, 张佩, 孙永昌, 等. 基于CFD-DEM的非球形颗粒水力输送数值模拟[J]. 中国粉体技术, 2022, 28(5): 82-91.
CHEN W, ZHANG P, SUN Y C, et al. Numerical simulation of hydraulic transport of non-spherical particles based on CFD-DEM[J]. China Powder Science and Technology, 2022, 28(5): 82-91.
[9]孙永昌, 张佩, 武煜坤, 等. 物料参数对立式搅拌釜混合性能影响的模拟[J]. 中国粉体技术, 2022, 28(6): 99-106.
SUN Y C, ZHANG P, WU Y K, et al. Simulation of effect of material parameters on mixing performance of vertical stirred tank[J]. China Powder Science and Technology, 2022, 28(6): 99-106.
[10]KUANG S B, LI K, YU A B. CFD-DEM simulation of large-scale dilute-phase pneumatic conveying system[J]. Industrial &Engineering Chemistry Research, 2020, 59(9): 4150-4160.
[11]宋学锋, 戴飞, 张锋伟, 等. 90°弯管内玉米颗粒气固耦合运动特性分析[J]. 中国农机化学报, 2018, 39(11): 67-71.
SONG X F, DAI F, ZHANG F W, et al. Analysis of gas-solid coupling movement characteristics of corn particles in a 90° bend[J]. Chinese Journal of Agricultural Mechanization, 2018, 39(11): 67-71.
[12]RABINOVICH Y I, ESAYANUR M S, MOUDGIL B M. Capillary forces between two spheres with a fixed volume liquid bridge: theory and experiment[J]. Langmuir, 2005, 21(24): 10992-10997.
[13]SUN X, SA M. A liquid bridge model for spherical particles applicable to asymmetric configurations[J]. Chemical Engineering Science, 2018, 182: 28-43.
[14]XIAO F, JING J, KUANG S B, et al. Capillary forces on wet particles with a liquid bridge transition from convex to concave[J]. Powder Technology, 2020, 363: 59-73.
[15]KANTAK A, GALVIN J E, WILDEMUTH D J, et al. Low-velocity collisions of particles with a dry or wet wall[J]. Microgravity Science and Technology, 2005, 17(1): 18-25.
[16]XIAO F, LUO M, KUANG S B, et al. Numerical investigation of elbow erosion in the conveying of dry and wet particles[J]. Powder Technology, 2021, 393: 265-279.
[17]WANG M, ZHU W, SUN Q, et al. A DEM simulation of dry and wet particle flow behaviors in riser[J]. Powder Technology, 2014, 267: 221-233.
[18]OLALEYE A K, SHARD T O, WALKER G M, et al. Pneumatic conveying of cohesive dairy powder: experiments and CFD-DEM simulations[J]. Powder Technology, 2019, 357: 193-213.
[19]ZHANG M H, CHU K W, WEI F, et al. A CFD-DEM study of the cluster behavior in riser and downer reactors[J]. Powder Technology, 2008, 184(2): 151-165.
[20]KUANG S B, ZHOU M M, YU A B. CFD-DEM modelling and simulation of pneumatic conveying: a review[J]. Powder Technology, 2020, 365: 186-207.
[21]毕大鹏, 张晋玲, 谢文选, 等. 水平管稀相气力输送气-固速度关系的实验研究[J]. 中国粉体技术, 2020, 26(2): 1-6.
BI D P, ZHANG J L, XIE W X, et al. Experimental study of gas-solid velocity relationship in thin phase pneumatic conveying in horizontal pipe[J]. China Powder Science and Technology, 2020, 26(2): 1-6.
[22]LI Z Q, ZHANG P, SUN Y C, et al. Discrete particle simulation of gas-solid flow in air-blowing seed metering device[J]. Computer Modeling in Engineering &Sciences, 2021, 127(3): 1119-1132.
[23]GIDASPOW D, LI F, HUANG J. A CFD simulator for multiphase flow in reservoirs and pipes[J]. Powder Technology, 2013, 242: 2-12.